Online Reporting (EHI)

The goal in the creation of EHI was to develop an application that could provide the insight and business practical information that allows a client to make significant decisions, as it relates to the value of investments, utilization, engagement, participation, and overall success of population health programs.
One of the unique features of the EHI application is that the findings the analysis shows are not based solely on correlations; but rather on inferential statistics that allow conclusions to be drawn about the degree of success of the population health programs implemented by the client.
While a robust engine and data warehouse drive the EHI backend, the user interface is designed to be easily navigated with a simple point and click functionality. This allows the user to “drill down” into the areas of interest or concern. The drill-down functionality can be driven by geographical variables, department designations, employee status, gender, age brackets, etc.- thus allowing for a complete picture of population health, by desired segmentation.
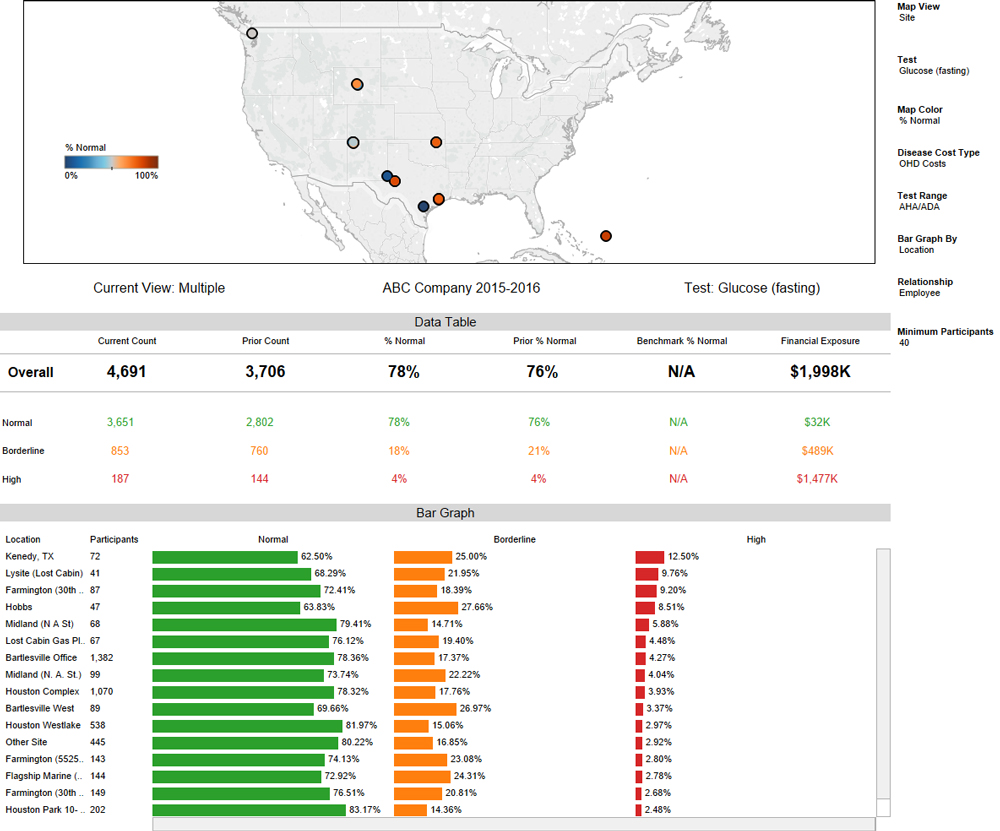
Campaign Views which include:
- “Point & Click” Interactive Heat Map at Country, Region, State, Metro Area and Street Address levels with the ability to combine locations as desired
- Toggle to graph a) health status of all locations with respect to one specific test or b) health status of all tests for one location
- Filter locations by number of participants (for relevance)
- Drill down into High-Risk Factor subcategory (i.e., Hypertension Stage I & Stage II) prevalence
- Filter results by age and gender
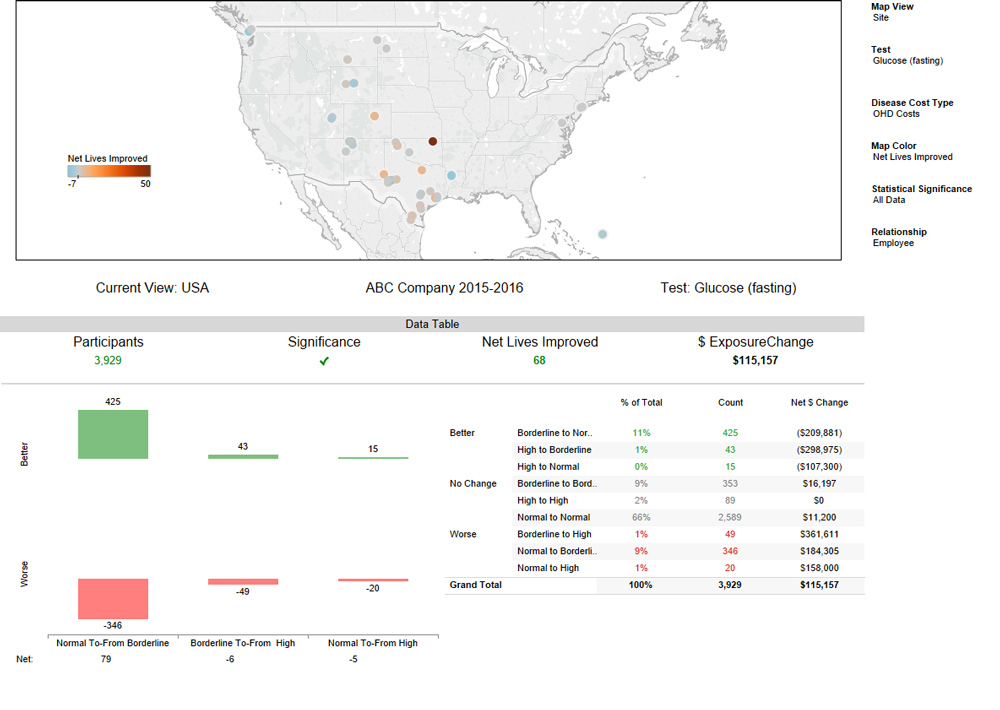
Year-on-Year Cohort Analysis Views which include:
- Statistical testing validation of either no change at all or year on year change and in which direction
- Graphical and tabular representations of year-on-year movement between risk categories (Normal, Borderline, and High)
- Calculation of “Net Lives Improved” (Number of people who improved minus number of people who got worse)
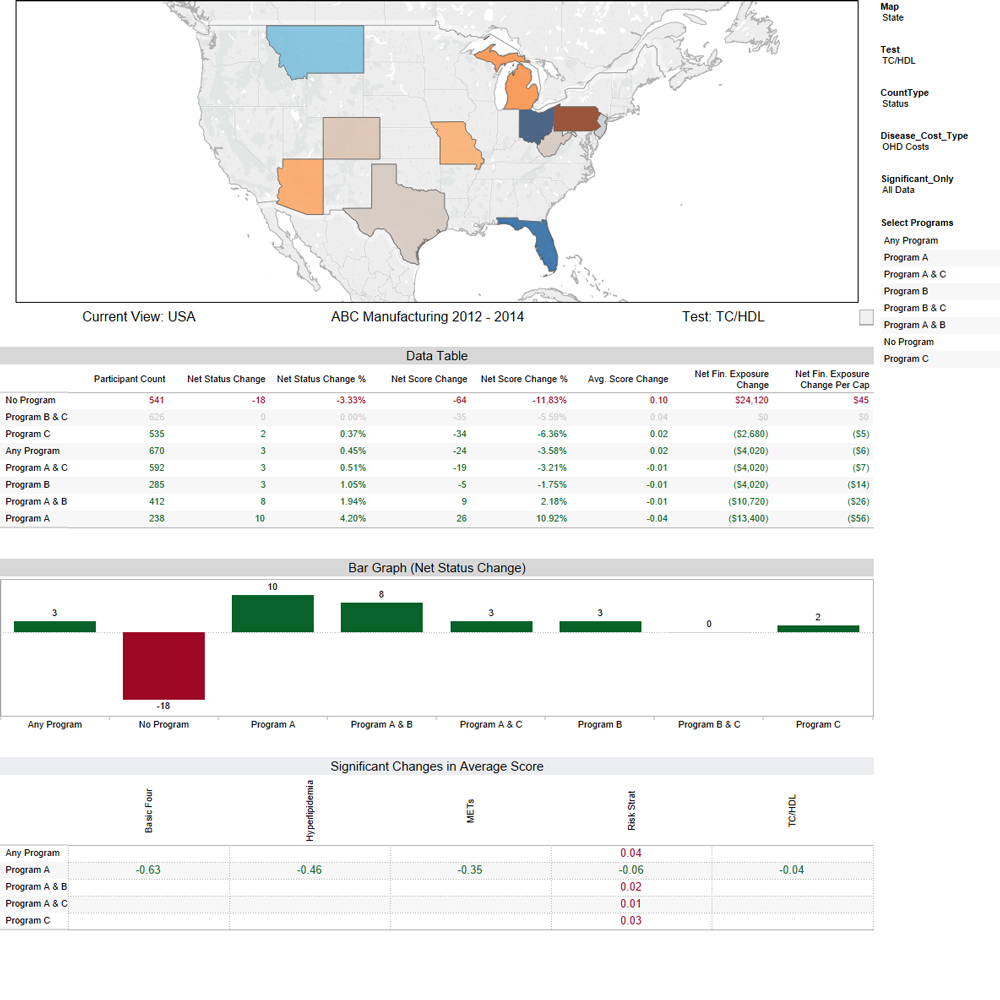
Program Effectiveness:
- Statistical testing validation of different Wellness or Disease Management Programs
- Were the programs successful in changing cohort disease status utilizing statistical significance
- Were number of positive net lives (status change) meet expectation


| Some of the Additional Employee Wellness Questions that Can Be Answered: |
|---|
| + Is employee wellness working? |
| + What’s the return on wellness? |
| + Is this specific employee wellness program offering a good investment? |
| + Easily answer age and gender specific questions |
| + Statistical validation: Can I expect these results again if I re-invest in the same behavior change program? |
| + Benchmark data: How does my company’s biometric screening data compare to peers? |
| + What are my employee health risks at company, regional, state, city & site levels? |